The Twin High-Leverage Points of Identification and Activation
AI offers great promise in health care analytics. Assigning patient scores by applying AI to Real-world Data (RWD) such as anonymous patient-level data (APLD) is straight forward and the deliverables, on the face of it, can be as simple as a list of HCPs associated with scored patients. Yet this is deceptive, and it can be particularly so in rare diseases and ultra-rare diseases. AI is constrained by basic statistical principles, even when overt statistical testing is not part of the analysis. For example, an undiagnosed patient population with a prevalence in the United States of 3000 patients is mixed in with a population of about 330 million people. We might generate an AI model that is, say, 95% accurate. However, what do we know about accuracy, per se, and is 95% accuracy sufficient in rare disease modeling?
High-Leverage Point 1: Leverage AI to Develop the Required Activation Strategies
Model accuracy: Not the best measure of performance in rare disease
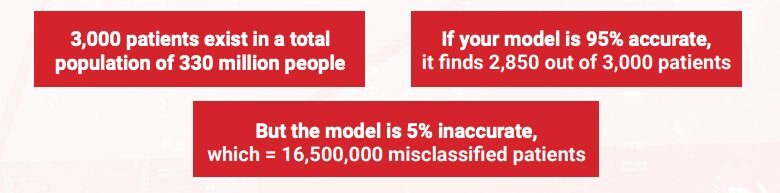
This is because we have “diluted out,” if you will, the correctly identified 2850 patients in ≈16.5 million misclassified patients. What other metric should we then focus on in rare disease patient-finding, if not accuracy?
Precision is the Metric to Focus on in Rare Disease Patient-Finding
In rare disease patient-finding analytics, the focus should be on PRECISION, not ACCURACY.
PRECISION = TP/(TP+FP) where TP refers to the “true positives,” our undiagnosed rare disease patients whom we correctly classify using the model, and where FP refers to “false positives,” the patients who don’t have the disease, but whom our AI model incorrectly classifies as undiagnosed rare disease patients.
Precision allows us to focus on controlling mistakes made on the millions and millions of non– rare disease patients we must score. The precision for our example 95% accurate AI model is approximately 2850/(2850+16,500,000) = 0.0002… or 0.02% precision.
“95% Accurate” is 99.98% Wrong in Rare Disease Diagnostics
So now we have our answer: Our “95% accurate” model is 99.98% wrong when used in rare disease, because small errors lead to large absolute numbers in the denominator above, reducing precision.
Below is a graphic that should drive home the point.
The graphic shows a few RED dots representing rare disease patients, dispersed in a sea of BLACK dots, representing the rest of the patients in the US health care system.
It’s easy to see why even a small percentage error on the sea of BLACK patients below will create “fake” or “false-positive” RED patients, which will drive our precision toward ZERO very quickly.

Don’t Swing at Every Pitch: Use Precision to Know When to Swing for the Fences!
Rather than using rank-order-descending, raw-AI-model patient scores to triage HCPs, each raw score should first be mapped to precision.
Once We Know Precision, We are No Longer Forced to “Swing Blindly at Every Pitch.”
We can avoid patients who may have only appeared to have value based on raw AI scores or, more generally, overall model “accuracy,” but who in fact have little value once we discover each patient’s true precision value, and we can limit our search to patients above some precision minimum.
Below we see that AI-model scores run through Real-World Data (RWD) validation are not terribly high precision after they fall below about 0.8. The plot below is called a Precision Receive Operating Characteristic “PR-ROC” plot. It is the appropriate tool to triage patients for relative value in rare disease patient finding.
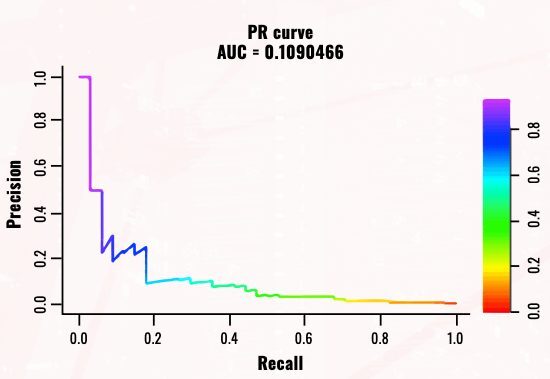
The value of the PR-ROC plot is that we can read the precision directly from the graph and map it to the raw AI-model scores using the color bar to the right of the plot. We see, for example, that a precision of 0.2 maps to an AI-model score of about 0.8. Thus, if we wish to avoid going below a 20% precision in doing HCP attribution for sales calls, we carry out HCP attribution on only the patients with a raw AI-model score of 0.8 or above.
The take-home message is clear: A complex and unpredictable nonlinear relationship always exists between any set of AI-model raw scores and their precision, and only the correct post-modeling validation process carried out under realistic conditions, using Real-World Data (RWD) intended for AI-model use, can establish this complex nonlinear relationship with assurance.
PR-ROC Plots Assign Precision While ROC Plots Do Not
We have established the utility of the PR-ROC chart, but a similar plot called a Receive Operating Characteristic (or “ROC”) plot is commonly used. This approach offers less value and more risk of misinterpretation when used under the conditions typical of rare disease patient modeling.
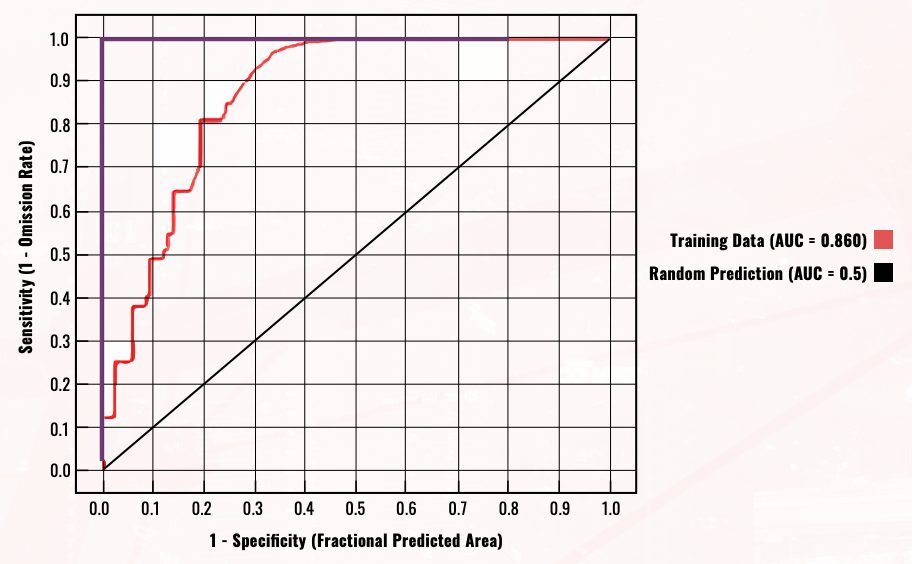
One key limitation is as follows: In ROC plots, the X-axis is the “true-positive rate” and the Y-axis is the “false-positive rate.” This should sound familiar by now: The two dimensions of the graph are in fact a decomposition of precision (recall that PRECISION = TP/[TP+FP]) into the 2 dimensions (X and Y) on the graph. Because of this decomposition, a separate “random line” (in the above, it has a slope of 1) is needed which must be specific to the data composition. In general, there’s a risk that the default settings for this line may misrepresent the situation in rare disease patient finding.
Unliked ROC plots, PR-ROC plots directly measure both precision and the capture rate (or “Recall”) of our true-positive rare disease patients while linking both to the raw AI-model scores. In the end, the PR-ROC is the correct tool to use, if not in place of, certainly in conjunction with, ROC plots. It offers a simple and direct assessment of both overall model performance and patient-level precision ranking, which ROC plots can’t provide.
81qd’s Orion Rare Disease & Difficult-to-Diagnose Disease Solution Solves the Precision Problem
At 81qd, we think carefully about precision before modeling begins, to address the various challenges noted above.
Estimates of precision are only as accurate as the human intelligence (HI) that goes into making a series of parameter estimates,
starting with desk research into the true prevalence of the rare disease of interest and moving down through the chain of factors that affect the prevalence in the data set we actually expose to Orion, our proprietary AI patient-finding solution.
At 81qd, we establish realistic and conservative parameters for these precision estimates, as well as for the validation of the AI model under real-world use conditions. The AI model must be validated after it is built. This validation must be done on simulated real-world conditions that reflect the true rarity that the model will see when it is used to score new patient data; otherwise, the precision estimates may be off by orders of magnitude.
Orion delivers high precision and high accuracy in part because we leverage not just AI, but also HI to carefully think through “what if” scenarios and conduct proof-of-concept (POC) studies.
Orion is carefully customized to each disease in order to deliver the high precision needed to conduct a patient search in the extremely large data universes where patients exist, without suffering from the usual loss of precision that other models suffer from when screening large numbers of patients. Orion limits the errors made in classifying non–rare disease patients that would otherwise rapidly reduce our precision to zero, such that it is capable of safely searching in Big Data space.
High-Leverage Point 2: Leverage AI to Develop the Required Activation Strategies
Finding HCPs who are managing yet-to-be-diagnosed patients with rare diseases is often said to be analogous to finding a needle in a haystack. A better analogy would be mining for gold: Knowing where to dig is only half the problem. The strategy for bringing this value to the surface is another matter.
Identifying the HCPs who have undiagnosed rare disease patients tells us where to dig, however we need to “bring this value to the surface,” as it were. We still need to formulate a strategy for accelerating diagnosis through patient activation. AI models give us important information we can use to build patient profiles for both diagnosed and undiagnosed rare disease patients.
These patient profiles form the basis for understanding why some patients may have short delays between first symptoms and diagnosis, and others take years or even decades. Actionable patient profiles allow us to formulate strategies for optimal activation that are specific to patient type.
Precision Identification: Tractable or Intractable Patients?
Patient Diagnostic Delay and Effective Patient Activation Tactics
The result is that the delay period between symptom onset and correct diagnosis is not correlated with AI-model scores.
So, a strategy needs to be put in place to profile patients and then form profiles-pecific strategies to accelerate diagnosis through HCP outreach, education, etc.
Failing this, as one might expect, a mixture of underrecognized disease-specific symptoms, conflated with other disease profiles and different rates of progression toward severity, will determine the diagnostic delay. Or, as Susan says, “Rare disease patient-finding is hampered by the very nature of rare diseases: they are rare and complex” (Susan Abedi, “Two Truths and A Lie”).
81qd Orion Profiling Helps Us in Tackling the Diagnostic Delay Problem
Comprehensive diagnosed and undiagnosed patient profiling is also necessary. Orion is in fact dual purpose in this regard. Orion not only finds undiagnosed patients, but also provides the insight needed to build the required diagnosed and undiagnosed patient profiles to assist in the formulation of patient activation strategies.
Partnering in Rare and Difficult-to-Diagnose Disease Demands Both AI and HI (Human Intelligence)
When partnering in the rare disease and difficult-to-diagnose disease space, experience counts. As Susan says, “Precision aside, one must be able to build an actionable communications plan based on the patient-finding models” (Susan Abedi, “Two Truths and A Lie”).
Beyond a track record of established AI capability, look for experienced “HI” able to deliver on strategy and tactics in support of well-defined, value-added, and client-actionable deliverables.
Some specific items to focus on in discussions with your analytics partners include an understanding of how they plan to measure the success of their AI model and how they define the scores they assign to each patient; as we saw, using the correct approach is critical to judging the ultimate utility of any deliverable. In addition, a discussion around activation might involve key deliverables such as both diagnosed and undiagnosed patient profiles designed to shorten diagnostic delay.